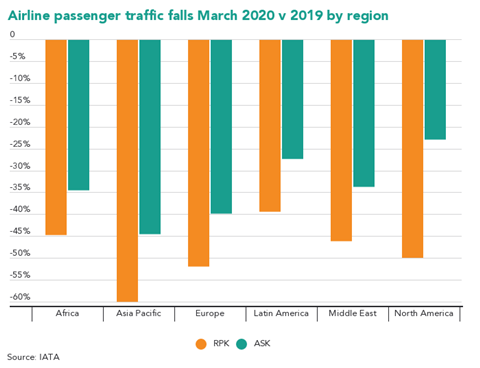
Figures from IATA for March show global airline passenger traffic already down by more than 50% and collective load factors falling in excess of 20 percentage points in a further illustration of how sharply the coronavirus crisis has hit the sector.
While February figures had shown a 14% fall in global airline passenger traffic, this was driven almost entirely by a sharp downturn in Asia-Pacific airline traffic. Africa was the only other region that month to report a fall, albeit only fractional.

But figures for March, released by the trade association today, show passenger traffic sharply down across all regions compared with the same month in 2019 as the pandemic spread across the globe - prompting a slew of travel restrictions and national lockdowns.
Carriers in Asia-Pacific again were the hardest hit. IATA figures show airline traffic among Asia-Pacific operators slumping just shy of 60%. This far outstripped the 44% cut in capacity, resulting in a 21.4 percentage point fall in passenger load factors to 58.9%.
This slump was even more pronounced on international routes, where Asia-Pacific carriers saw traffic slump 65% and load factors tumbled by 23.4 points.
While traffic was down 65% in the Chinese domestic market - the second biggest in the world - in March, this marked an improvement on the 85% fall in February. This reflects the gradual re-opening of the Chinese market, which had been the first impacted by the coronavirus outbreak.
Asia-Pacific carriers account for the largest regional share of global traffic, just over a third of all RPKs in March.
Airlines from Europe, the region accounting for the second biggest share of RPKs, also endured a fall of more than half of traffic. Total European traffic fell 52%, again far out-pacing the cuts in capacity over the same period. As a result, European airline load factors slumped almost 17 points to 67%.
Traffic among North American carriers was also down by roughly half in March compared with the previous year. As capacity was cut by less than quarter - the smallest percentage reduction of any region - carriers in North America logged an almost 30 point slump in load factor to 55.7%.
That in part reflects relatively light capacity reductions in domestic capacity in March. North American domestic traffic was 48% down on capacity cut only 14%. This resulted in a near 34 point fall in domestic load factors.
Asia-Pacific, European and North American carriers account for almost 84% of global passenger traffic.
“March was a disastrous month for aviation,” says IATA director general Alexandre de Juniac. ”Airlines progressively felt the growing impact of the COVID-19 related border closings and restrictions on mobility, including in domestic markets.
”Demand was at the same level it was in 2006 but we have the fleets and employees for double that. Worse, we know that the situation deteriorated even more in April and most signs point to a slow recovery,” he adds.
While traffic and load factor falls were lower in the three other regions, they were still all sharply down.
Traffic among Middle East operators was down 46% on capacity cut nearly 34%, leading to a 13.5 point fall in load factors.
African operators recorded an 11 point fall in load factors as traffic fell 44.5%, while traffic among Latin American carriers was 39% lower and its load factors 13.5 points down.
IATA has already estimated global passenger traffic in 2020 will be down 48% on the 2019 figure. It expects this to translate into a $314 billion loss in passenger revenues.


